A big way our antiquated political system has let us down (way down) in recent years is the growth of inequality. It all goes back to the Reagan Revolution:
In August 1981, President Reagan signed the Economic Recovery Tax Act of 1981, which enacted a 27% across-the-board federal income tax cut over three years, as well as a separate bill that reduced federal spending, especially in anti-poverty programs [Wikipedia].
The Tax Reform Act of 1986 was the top domestic priority of President Reagan’s second term. The act lowered federal income tax rates, decreasing the number of tax brackets and reducing the top tax rate from 50 percent to 28 percent [Wikipedia].
Income tax rates have fluctuated since then under Republican and Democratic administrations without much change to Reagan’s policies. And when we consider the many deductions, exemptions and loopholes that tax lawyers and accountants are paid to take advantage of for their moneyed clients, effective tax rates have always been lower than the official rates.
I was reminded of this history when somebody linked to a new site called Realtime Inequality. It was created by three UC Berkeley economists in order to show how different “income and wealth groups” benefit or fall behind when new growth numbers come out each quarter”:
Realtime Inequality provides timely and high-frequency estimates of the distribution of income and wealth in the United States. Our statistics distribute the totality of national income and household wealth across socio-economic groups and are updated each quarter when new macroeconomic numbers are published. (National income is similar to Gross Domestic Product and a better indicator of income earned by US residents.)
This makes it possible to estimate economic growth by socio-economic groups consistent with quarterly releases of macroeconomic growth, and to track the distributional impacts of government policies during and in the aftermath of recessions in real time.
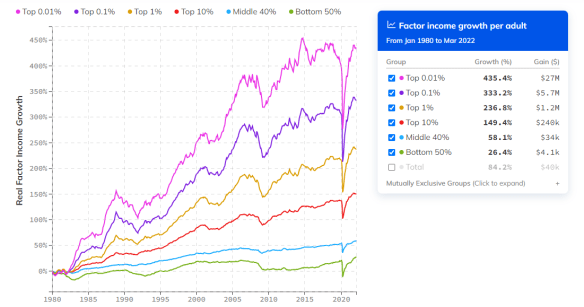
The site has graphs for both income and wealth that you can play around with for different groups and time periods. Thus, one measure of income growth between January 1980 and March 2022 shows that income (corrected for inflation) rose 333% for the top tenth of one percent and 26% for the bottom fifty percent.
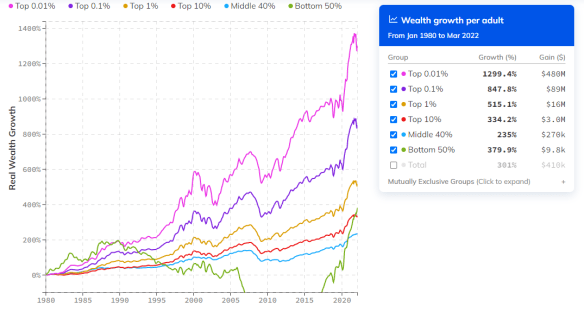
While one measure of wealth for the same period grew by $89 million for the upper tenth of one percent and less than $10,000 for the bottom fifty percent.
It’s kind of fun to play with if you don’t think about it too hard.


You must be logged in to post a comment.